What this guide is for
This guide is about the skills you use on every question of the GED Science test, whatever the question is about. The test calls these skills the science practices. They are: reading a science passage carefully, understanding how an experiment is set up, reading tables and graphs, deciding what a set of results does and does not show, working with numbers and units, and using simple averages and chances.
Read this guide first, before the guides on life science, physical science, and earth and space science. Those guides teach facts about living things, matter and energy, and the Earth and sky. This one teaches how to read and think about any of them. Every guide after it leans on what is here.
Read the parts in order. Each part explains its topic in plain steps, walks through worked examples, and ends with a question to think through or a few practice questions that check themselves. Each part also names the Look Again quiz that goes with it, so that you can practice the same skill with ten more questions. Keep paper, a pencil, and a calculator beside you.
At the end there are fifteen questions on the whole guide, and a list of the terms it uses.
Goes with: Change One Thing · the Method Wheel · Look Again Quizzes 1 to 7
In this guide:
What the test asks you to do
The GED Science test covers three areas. About 40 percent of the questions are about life science (living things), about 40 percent are about physical science (matter, energy, chemistry, and physics), and about 20 percent are about earth and space science (the Earth, the weather, the planets, and the stars).
That sounds like a great deal of material to remember. But the test is built in a way that helps you. Nearly every question comes with something to read or to look at first: a short passage, a table of numbers, a graph, or a diagram. This material is called the stimulus. (A stimulus is anything that gets a response; here it is the material the question asks you to respond to.)
The question then asks what the stimulus shows, or what you can fairly conclude from it. You are rarely asked to recall a fact cold, which means from memory, with nothing in front of you to help. The information you need is usually on the screen.
This also explains the most common mistake on the test. An answer choice can be true about the world and still be the wrong answer, because the stimulus never said it. The question is not “What do you know about this subject?” It is “What does this material say, and what follows from it?”
Most science questions are answered from the passage, table, graph, or diagram in front of you. Your job is to find the answer there and to reason from it, not to remember it.
Three kinds of question
Science questions come in three main kinds. Certain words in the question tell you which kind you have.
- What does it say? The question often begins “According to the passage” or “According to the table.” The answer is written down somewhere in the stimulus. Your job is to find the line or the number.
- What does it mean? The question often says “Based on the data” or “Which conclusion is best supported.” The answer is not written down, but it follows from two or three things that are.
- What would happen? The question describes a new situation, such as “A student repeats the experiment using warmer water.” You take the pattern or rule from the stimulus and apply it to the new case.
The order to read in
Reading every word of a passage slowly before you know what you are looking for takes time you may need later. This order works better:
- Glance at the stimulus for a few seconds. What is it about? If it is a table or graph, what are the headings, the labels, and the units? Do not study it yet.
- Read the question carefully, all the way to the end, and read the answer choices. Find out exactly what is being asked.
- Go back to the stimulus and read closely the part that the question needs.
- Point to your evidence. Before you choose, find the line or the number that supports your choice. If you cannot point to anything, look again.
A student timed how long one load of wet towels took to dry in the dryers at a laundromat, on each of three settings.
| Dryer setting | Minutes to dry one load |
|---|---|
| Low | 60 |
| Medium | 45 |
| High | 35 |
Question 1. According to the table, how long did the load take on Medium? “According to the table” tells you the answer is written down. Find the Medium row and read across: 45 minutes. Nothing needs to be worked out.
Question 2. Which statement does the table best support? Now the answer is not written down; it follows from the numbers. “In this test, the load dried faster on higher settings” is supported: 60, then 45, then 35 minutes. A choice such as “High heat can shrink cotton towels” may well be true, but the table says nothing about shrinking, so it is not the answer.
Question 3. The student puts a load in on Medium at 2:00. About when should it be dry? This is a new situation. Use the table’s number for Medium: 45 minutes after 2:00 is 2:45.
Practice
Choose an answer, then press Check. The explanation opens either way.
A question begins, “According to the graph, in which month…” What does the phrase “according to the graph” tell you?
The phrase tells you the answer is shown on the graph; your job is to find it. Using a fact from school is the tempting wrong choice, but GED science questions rarely ask you to recall a fact cold.
A passage describes a study of plants in a greenhouse. One answer choice states a true fact about plants that the passage never mentions. Should you choose it?
The question is about what the passage says or supports. A choice that is true in the world but not in the passage is the most common trap on the test. The first choice is tempting because the statement is true; but true is not the same as supported by this passage.
Practice the three kinds of question with ten more: Look Again Quiz 1: Reading Science.
Reading a science passage
Many questions on the test begin with a short science passage: a paragraph or two describing an observation, an experiment, or a discovery. Reading one well comes down to four habits.
1. Tell the main idea from the details
The main idea is what the whole passage is mostly about, said in one sentence. The details are the particular facts, numbers, and examples that fill it in. A good test for a main idea: it should fit the whole passage, not just one sentence of it. A choice that matches one sentence exactly is usually a detail, not the main idea.
2. Find out what the question is actually asking
Read the question slowly and notice the small words that change it. NOT and EXCEPT turn the question around: “Which of these is NOT a result of the experiment?” asks for the one choice that does not fit. Most likely and best mean that more than one choice may seem possible, and you must pick the one with the most support. If a question asks about the first study, an answer about the second study is wrong even if it is true.
3. Separate evidence from claims
Evidence is what someone observed or measured: a temperature, a count, a time, what was seen under a microscope. A claim is a statement about what the evidence means: why it happened, or what it shows about the world. Evidence can be perfectly accurate while the claim built on it goes too far. Many test questions ask you to tell the two apart.
4. Notice how strong the words are
Scientists choose words that match how much their evidence can carry. From weakest to strongest:
| Word | What it means |
|---|---|
| is consistent with | the evidence fits the idea, but it might fit other ideas just as well |
| suggests | the evidence points toward the idea, but more testing is needed |
| supports | the evidence gives a good reason to accept the idea |
| shows | the evidence makes the idea clear, at least for the cases that were tested |
| proves | the idea is settled beyond doubt; one study almost never does this |
Words such as all, every, always, never, and only also make a statement very strong. One case that does not fit is enough to make the statement false. Words such as most, tends to, on average, and in this study are more careful. On the test, an answer choice with proves or always is wrong far more often than it is right, because it claims more than the evidence can carry.
Keep two things apart as you read: what was measured (the evidence) and what someone says it means (the claim). A good conclusion says no more than the evidence supports.
Read the passage, then the four questions about it.
On a hot afternoon in July, a group of high school students in the South Bronx measured the temperature of the sidewalk on two nearby blocks. One block had a row of large street trees. The other block had no trees. Every half hour from noon to 4:00 p.m., they measured both sidewalks with the same thermometer. At every reading, the sidewalk on the block with trees was 20 to 30 degrees Fahrenheit cooler. The students wrote that shade from street trees may help keep city blocks cooler in summer.
What is the main idea? Students compared sidewalk temperatures on a block with trees and a block without, and found the shaded sidewalk cooler. That sentence covers the whole passage. “They measured every half hour” is a detail: true, but only one part.
Which sentence is evidence, and which is a claim? “The sidewalk on the block with trees was 20 to 30 degrees cooler” is evidence: it was measured. “Shade from street trees may help keep city blocks cooler” is a claim: it says what the measurements mean.
Is the claim careful? Yes. The students wrote may help, not proves. That is a good choice, because they measured two blocks on one afternoon. The blocks might also differ in other ways, such as the color of the pavement or how much traffic passes.
Which conclusion is best supported? “On that afternoon, the sidewalk on the block with trees was cooler than the sidewalk on the block without trees” stays inside the evidence. “Street trees cool every city in every season” goes far beyond it: the students measured one afternoon in July on two blocks.
Think it through. A friend reads the passage above and says, “So this proves trees are the reason the Bronx block was cooler.” What would you tell her?
Show a model answer
The measurements show that the shaded sidewalk was cooler on that afternoon, and they support the idea that the shade helped. They do not prove it. The students measured only two blocks on one day, and the blocks may differ in other ways besides trees, such as the pavement. To make the case stronger, they could measure many pairs of blocks, on many days, and choose blocks that are alike except for the trees.
For more practice with claims and strength words, see Look Again Quiz 1 and Look Again Quiz 5: Reasoning from Data.
The scientific method and a fair test
Science finds things out by testing ideas against what actually happens. The steps scientists follow are often called the scientific method. The GED will not ask you to recite the steps. It will describe someone’s experiment and ask you to name its parts, find its mistake, or say what its results show. For that you need the parts by name.
The steps, one at a time
- Question. Something you noticed and want to explain. It must be narrow enough that a test could answer it. “Do bananas ripen faster in a paper bag?” can be tested. “What is the best fruit?” cannot.
- Hypothesis. A possible answer to the question, stated so that a test could show it to be wrong. A hypothesis is a statement, not a question. It is often written as an “if … then” sentence: If bananas are kept in a closed paper bag, then they will ripen faster than bananas kept on an open shelf.
- Experiment. A test set up so that only one thing differs. This step has the most vocabulary, explained just below.
- Data. What you actually observed and recorded, written down before you decide what it means.
- Conclusion. What the data supports, and no more. “The hypothesis was wrong” is a real conclusion. It is not a failed experiment; it is something learned.
- Share the results. Report what you did and what you found, in enough detail that other people can repeat the test.
The parts of an experiment
- The independent variable is the one thing you change on purpose. (A variable is anything in an experiment that can change.)
- The dependent variable is what you measure to see the effect. It is called dependent because its value may depend on the change you made.
- The controlled variables are everything else that could affect the result, kept the same for every part of the test. Some books and quizzes call them constants.
- The control group gets no treatment, or the usual treatment. It is the comparison. The group that gets the change is called the experimental group.
- Repeated trials means running the test more than once, or testing many items instead of one. A single result can come from chance or from a mistake. If the same result comes up again and again, you can trust it more.
One way to keep the first two straight: the independent variable is what you do; the dependent variable is what you watch.
A fair test changes only one thing (the independent variable), measures the result (the dependent variable), and keeps everything else the same (the controlled variables). If two things change at once, no result can tell you which one mattered.
Why others must be able to repeat the test
A result from one experiment is not yet something everyone can rely on. The scientist may have made a mistake, or the result may have been luck. It becomes trustworthy when other people, working separately, follow the same steps and get the same result. This is called replication (repeating an experiment to check it). It is why scientists write down exactly what they did. If no one else can get the result, scientists do not accept it, however exciting it sounded at first.
Worked example: designing a fair test
The owner of a bodega in Washington Heights hears that bananas ripen faster in a paper bag. She wants to find out for herself before she changes how she stores them. How should she set up a fair test?
Step 1. The question. Do bananas kept in a closed paper bag ripen faster than bananas kept on an open shelf?
Step 2. The hypothesis. If bananas are kept in a closed paper bag, then their peels will develop brown spots sooner than the peels of bananas on an open shelf.
Step 3. The independent variable. The one thing she changes: bag or no bag.
Step 4. The dependent variable. What she measures: the number of days until the peel has brown spots. She decides ahead of time exactly what counts as “spotted,” so that she judges every banana the same way.
Step 5. The controlled variables. Everything else that could affect ripening must be the same for both groups: bananas from the same bunch, equally green at the start, on the same shelf, in the same room, at the same temperature, checked at the same time every day.
Step 6. The control group. The bananas on the open shelf. Without them she would have nothing to compare the bagged bananas with.
Step 7. Repeated trials. One banana in each group could give a misleading result, because one banana might simply be riper inside. She uses four bananas in each group, and she repeats the whole test with a new bunch the following week.
If the bagged bananas spot sooner, week after week, she has good evidence for her hypothesis. If they do not, she has learned that too.
Spotting the flaw in a badly designed experiment
The test often describes an experiment with a mistake in it and asks you to find the mistake or to say how to fix it. Most mistakes are one of these four: more than one thing was changed; there was no control group to compare with; too few trials or too few subjects; or the conclusion claims more than the data shows.
A student wants to know whether a new laundry detergent removes grass stains better than his usual one. He washes one stained shirt with the new detergent in hot water at a laundromat. At home, he washes another stained shirt with his usual detergent in cold water. The first shirt comes out cleaner. He concludes that the new detergent is better. What is wrong?
Ask: what was different between the two tests? The detergent, but also the water temperature (hot and cold) and the machine (laundromat and home). Three things changed at once.
So what can he conclude? Very little. The hot water or the laundromat machine could have cleaned the shirt better, with no help from the detergent. He cannot tell which change mattered.
How to fix it. Use the same machine and the same water temperature for both shirts, change only the detergent, make the stains the same way on shirts of the same fabric, and repeat the test with several shirts for each detergent.
Practice
Choose an answer, then press Check. The explanation opens either way.
A gardener at a community garden tests whether coffee grounds help pepper plants grow. Ten plants get coffee grounds mixed into the soil; ten plants get none. All twenty get the same soil, water, and sunlight. After six weeks she measures each plant’s height. What is the dependent variable?
The dependent variable is what she measured: the height of the plants. Whether a plant got coffee grounds is the tempting wrong choice, but that is what she changed on purpose, so it is the independent variable.
In the same experiment, which plants make up the control group?
The control group is the comparison group that gets no treatment: the ten plants without coffee grounds. If you chose the plants that got coffee grounds, you may have read “control” as “the group being changed.” The control group is the one left alone.
Which of these is written as a hypothesis?
A hypothesis is a statement that a test could show to be wrong, often in “if … then” form. The first choice is about the same subject and is tempting, but it is a question. A question comes before the hypothesis.
Think it through. Why is it not enough to test one banana in a bag and one banana on the shelf, even if everything else is kept the same?
Show a model answer
One banana could be unusual. It might have been riper inside to begin with, or bruised. With only one in each group, a difference could come from the bananas themselves and not from the bag. Using several bananas in each group, and repeating the test, makes it much less likely that chance is behind the result.
Take apart more experiments in Change One Thing, keep the steps on the Method Wheel, and practice with Look Again Quiz 2: The Scientific Method.
Tables and graphs
Science questions are full of tables and graphs, because they show many measurements at once. They are also where many points are lost, usually because someone reads the wrong row or the wrong line. Slow, careful habits fix most of that.
Reading a table
A table puts measurements in rows and columns. Before reading any number, read the title (if there is one) and the heading of every column. The headings tell you what was measured and in what units (centimeters, minutes, degrees, and so on).
A class rolled a toy car down a ramp, set at different heights, and measured how far it rolled across the floor.
| Height of ramp (cm) | Distance rolled (cm) |
|---|---|
| 10 | 55 |
| 20 | 98 |
| 30 | 151 |
| 40 | 204 |
Read one value. How far did the car roll from the 30 cm ramp? Find 30 in the first column and read across: 151 cm.
Find the trend. A trend is the general direction of the numbers. Read down both columns together: as the ramp gets higher, the car rolls farther. Each extra 10 cm of height adds roughly 50 cm of distance (98 − 55 = 43; 151 − 98 = 53; 204 − 151 = 53).
Name the variables. The class changed the ramp height on purpose, so that is the independent variable. They measured the distance, so that is the dependent variable.
Four kinds of graph, four jobs
- A line graph shows how something changes, usually over time. A steep line means fast change; a flat line means little change.
- A bar graph compares separate groups, such as four brands or five neighborhoods. Taller bars mean larger amounts.
- A circle graph (also called a pie chart) shows the parts of one whole. The slices add up to 100 percent.
- A scatterplot shows whether two measurements go together. Each dot is one item, such as one day or one person, measured two ways.
Before you read a single value
Read the title. Read the label on each axis (the two lines along the bottom and the side of a graph; the bottom one is the x-axis, the side one is the y-axis). Read the units. Read the key if there is one: the small box that says what each color or line stands for. And look at the scale: what number each mark on the axis stands for, and whether the y-axis starts at zero.
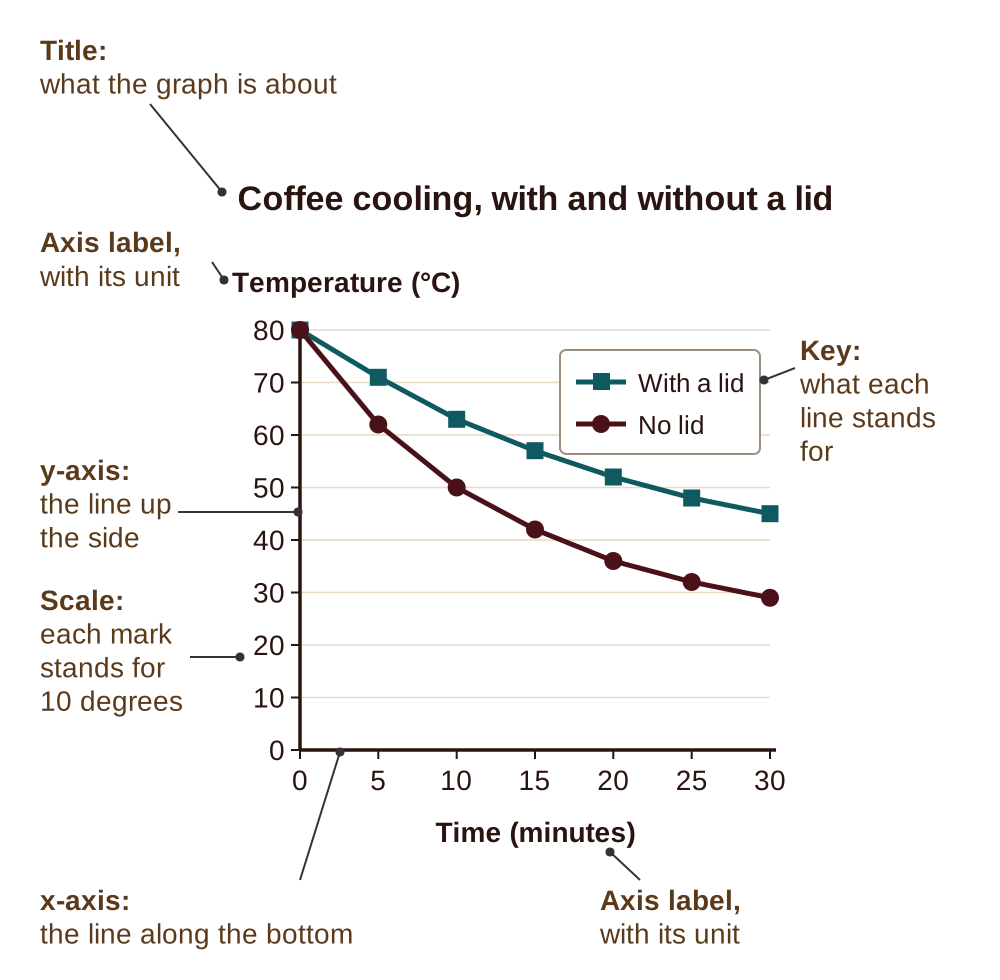
On a graph of an experiment, the independent variable usually goes along the x-axis and the dependent variable goes up the y-axis.
A line graph, read step by step
Someone measured the temperature of a cup of hot coffee every 5 minutes as it cooled. The graph shows the results.
Read a value. What was the temperature at 10 minutes? Find 10 on the x-axis, go straight up to the line, then straight across to the y-axis: 50 °C.
Find the trend. The line goes down the whole time, so the coffee kept cooling. It is steep at the start (80 to 62 degrees in the first 5 minutes, a drop of 18) and much flatter at the end (32 to 29 degrees in the last 5 minutes, a drop of 3). The coffee cooled fast at first, then more slowly.
Read between two points. No one measured the temperature at 12½ minutes. But the coffee was 50 degrees at 10 minutes and 42 degrees at 15 minutes, so at 12½ minutes, halfway between, it was about halfway between: about 46 degrees. Estimating a value between measured points is called interpolation. It is usually safe, because you have measurements on both sides.
Read beyond the last point. What will the temperature be at 60 minutes? Estimating past the end of the data is called extrapolation. If you simply continue the last part of the line straight ahead (the dotted line), you get about 11 degrees at 60 minutes. But that cannot be right: the room is 22 degrees, and coffee left on a table does not get colder than the room around it. The real curve flattens out and levels off near 22 degrees.
Reading between measured points (interpolation) is usually safe. Reading beyond them (extrapolation) is a guess, and the farther you go, the riskier it is, because the pattern may change where no one measured.
A bar graph
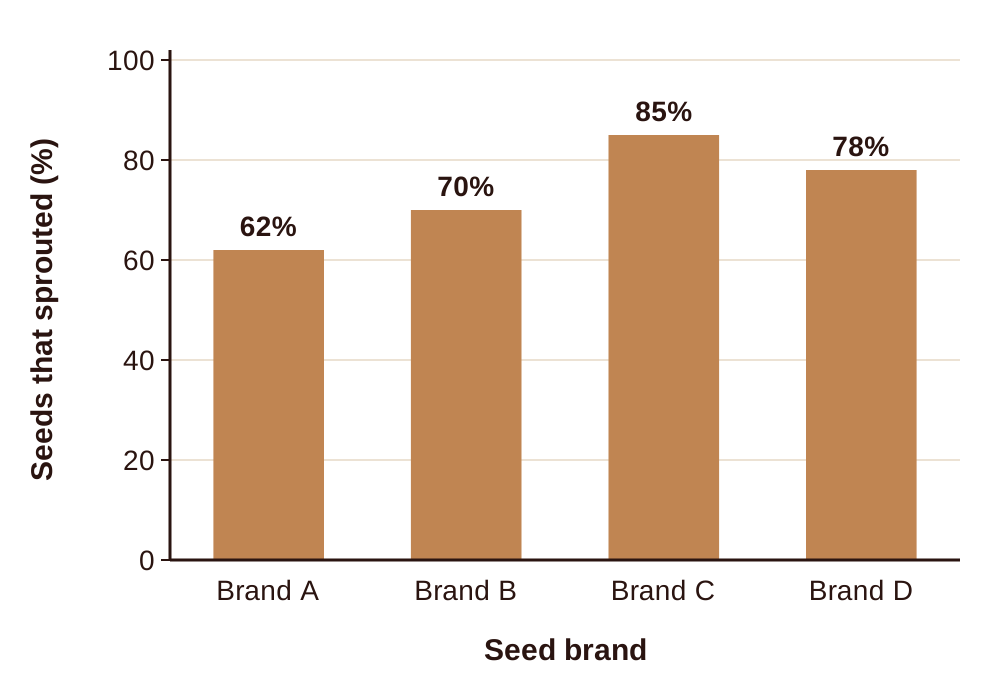
Read each bar by going from its top straight across to the y-axis, or by reading the number printed on it. Brand C had the highest rate, 85 percent. Brand A had the lowest, 62 percent. The difference between them is 85 − 62 = 23 percentage points.
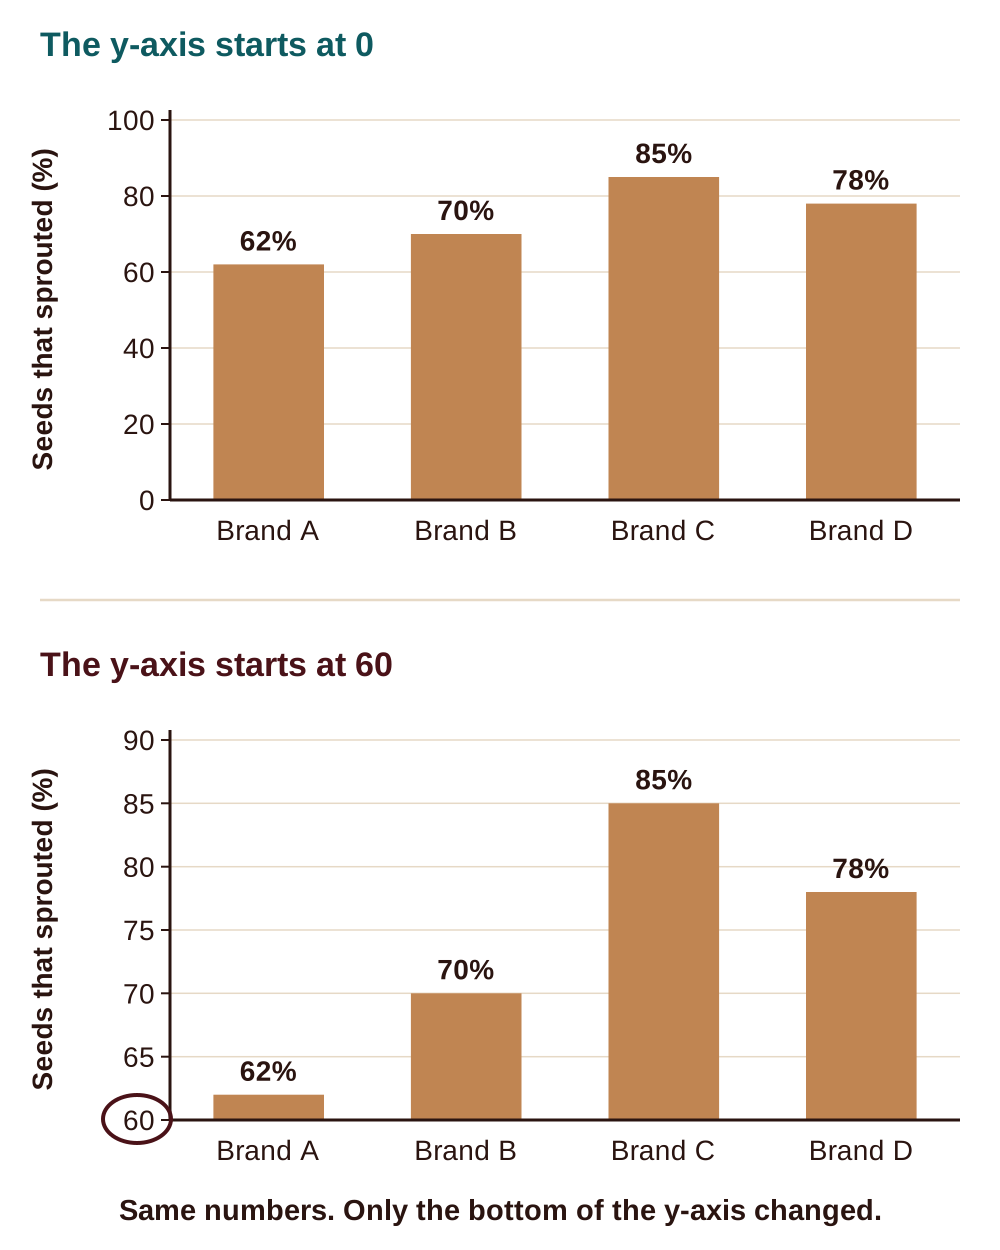
Notice that this y-axis starts at zero. Sometimes a graph’s y-axis starts at a higher number, such as 60. Then the bars show only the part above 60, and a small difference can look huge: on such a graph, Brand C’s bar would look more than ten times as tall as Brand A’s (25 against 2), even though 85 percent is not even one and a half times 62 percent. Always check the bottom of the y-axis, and compare the numbers, not just the heights.
A circle graph
Each slice is a percent of the whole garden, and the slices add up to 50 + 20 + 15 + 10 + 5 = 100 percent. To turn a percent into a number of plots, change the percent to a decimal and multiply by the total. Flowers take 20 percent of 40 plots: 0.20 × 40 = 8 plots. Vegetables take 50 percent, which is half: 20 plots.
A circle graph shows one whole at one time. It cannot show change over time, and it cannot compare two different wholes.
A scatterplot
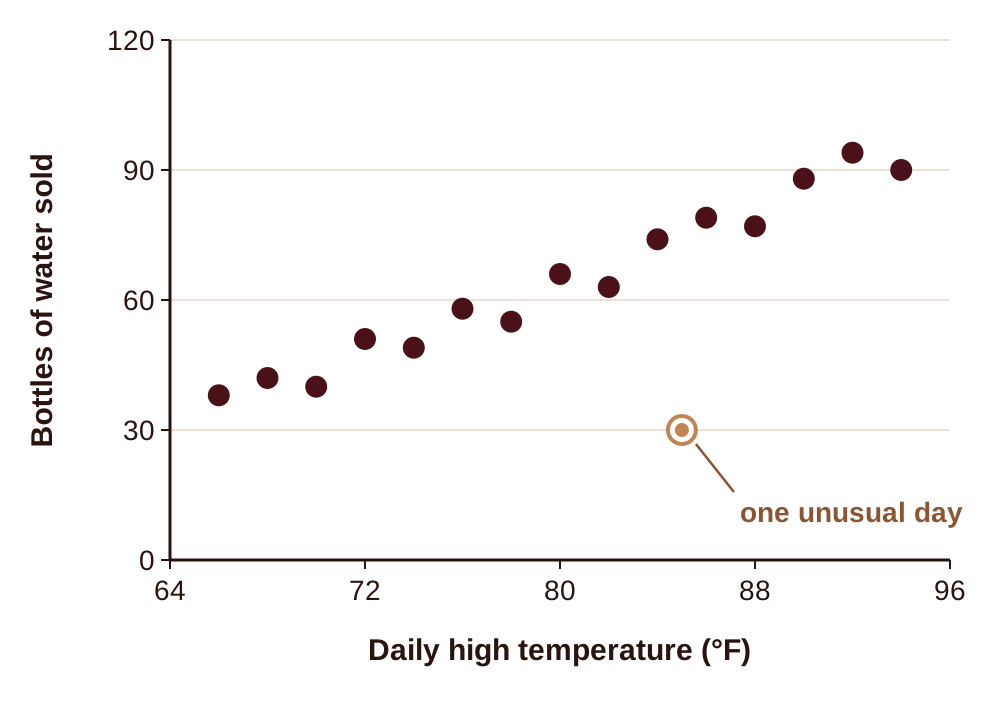
To read a scatterplot, look at the cloud of dots as a whole. Here the dots rise from the lower left to the upper right: on hotter days, the store tended to sell more water. When one measurement tends to rise as the other rises, the two have a positive relationship. If the dots fell from upper left to lower right, the relationship would be negative. If they were scattered with no direction, there would be no clear relationship.
One dot sits far from the others: a day at 85 degrees when only 30 bottles were sold. A point like this is called an outlier. An outlier is not automatically a mistake. It raises a question: what else was going on that day? Perhaps the store was closed for half the day. The graph alone cannot tell you.
A scatterplot shows a tendency, not a rule. Notice the words tended to. Not every hotter day sold more water than every cooler day.
Practice
Choose an answer, then press Check. The explanation opens either way.
On the coffee graph, between which two times did the temperature drop the most?
From 0 to 5 minutes the temperature fell from 80 to 62 degrees, a drop of 18. That is the steepest part of the line. The 5 to 10 minute stretch is tempting because it is also steep, but it dropped only 12 degrees (62 to 50).
Using the scatterplot, about how many bottles of water did the store sell on the 90-degree day?
Find 90 on the x-axis and go up to the dot: it sits just under the 90 line, at about 88 bottles. About 30 is the outlier, a different day at 85 degrees.
More practice: Look Again Quiz 3: Tables and Graphs. For diagrams such as cycles and flowcharts, see Look Again Quiz 4: Diagrams and Models.
Reasoning from data
Many of the hardest questions on the test have the same shape. Here is a result. Here is what someone says it means. Do the two match? This part gives you ways to answer that.
A conclusion the data supports
A conclusion is a statement about what the results mean. A supported conclusion stays inside the evidence: the same people or things that were studied, the same place, the same time, and the same size of effect. When a conclusion is stretched to cover more than was tested (all people, all places, all the time), it is no longer supported.
Before you choose a conclusion, say the finding to yourself in the plainest words you can, for example: “in this test, the bagged bananas spotted two days sooner.” Then check each answer choice against that sentence. If a choice says more, the extra part did not come from the data.
Correlation and causation
Two things that tend to happen together, or rise and fall together, have a correlation. One thing making another happen is causation. A correlation does not by itself show causation.
Here is an example. On summer days when an ice cream stand at Coney Island sells more ice cream, lifeguards on the beach also make more rescues. The two numbers rise together. But ice cream does not cause swimmers to get into trouble. A third thing causes both: hot, sunny weather brings more people to the beach, and more people means more ice cream sold and more swimmers in the water. A hidden third thing like this is the most common reason two unrelated things appear connected.
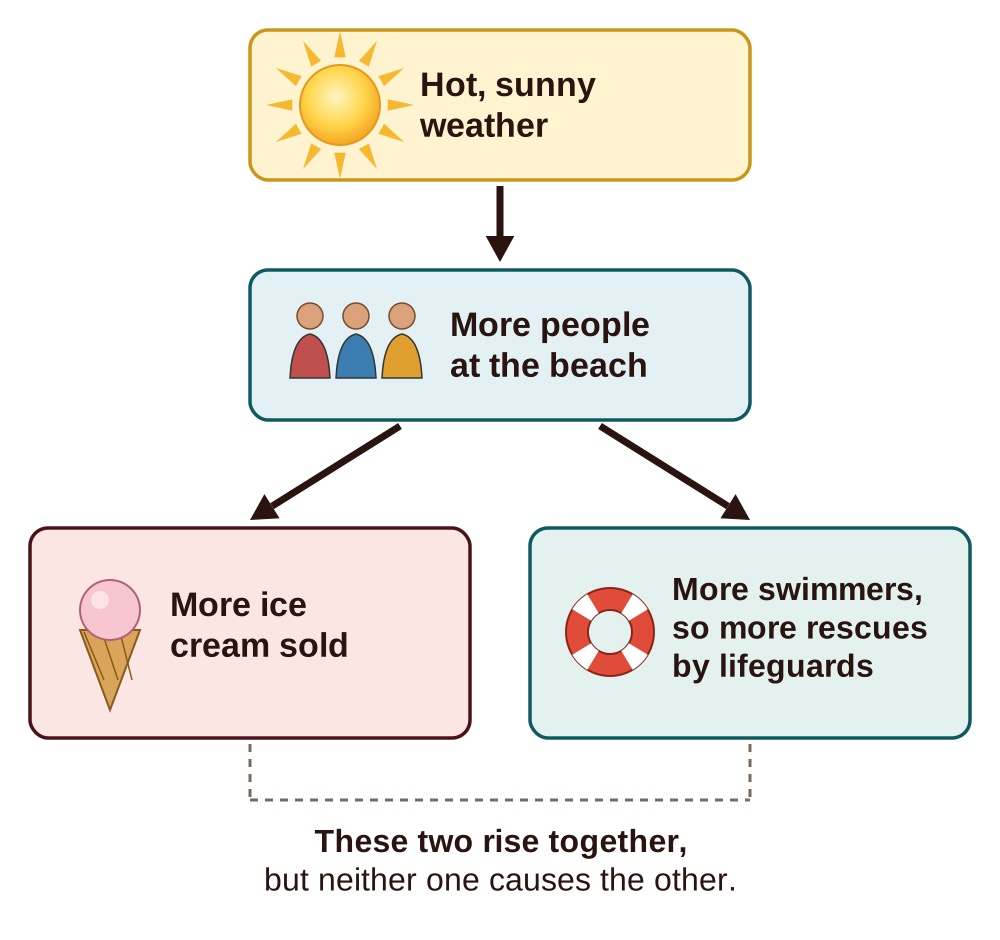
When two things rise together, there are four possibilities:
- The first causes the second.
- The second causes the first.
- Something else causes both.
- It is a coincidence.
Data showing only that two things go together cannot tell you which of the four is true. To show that one thing causes another, scientists usually need an experiment: they assign people or things to a treatment group and a control group (best of all, by chance, such as a coin flip), change only the one thing, and compare.
Two things happening together (correlation) is not proof that one causes the other (causation). Look for a third thing that could cause both.
Judging a claim
When the test gives you a claim, ask three questions:
- How far does the evidence reach? How many people or things, in what place, over how long?
- Does the claim say what the data says, or something stronger? Watch for upgraded words: proves instead of suggests, all instead of most.
- Is there another explanation that fits the same numbers? Another change at the same time, a third factor, or chance.
Sample size
The sample is the group that was actually studied, and the sample size is how many were in it. Small samples can mislead, because chance plays a bigger part. If a laundromat owner asks 4 customers whether they want the store open later and 3 say yes, that is 75 percent, but one different answer would make it 50 percent. If she asks 300 customers, a few unusual answers barely change the result.
The sample also has to be like the larger group the claim is about. Asking only the customers who come in at 10:00 at night tells her about late-night customers, not about everyone.
A company tested a new shower head in 12 apartments in one building in Queens. Over one month, those apartments used 15 percent less hot water on average than in the month before. The company’s advertisement says: “Proven to cut every family’s hot water use by 15 percent.” Judge the claim.
How far does the evidence reach? Twelve apartments, one building, one month.
Does the claim say more than the data? Yes, twice. Proven is far stronger than one small test can support. Every family is stronger than on average: some of the twelve apartments may have saved more than 15 percent and some less.
Is there another explanation? The two months may have differed. If the test month was warmer, people may have taken shorter or cooler showers anyway. Without a control group of similar apartments that kept their old shower heads during the same month, this cannot be ruled out.
A fair statement of the result: “In one test of 12 apartments, hot water use was 15 percent lower on average in the month after the new shower heads were installed.”
Think it through. A news story reports that people who own dogs are less likely to have heart disease. Give two explanations, besides “owning a dog protects your heart,” that fit the same finding.
Show a model answer
First, the arrow could run the other way: people who are already healthy are more able to care for a dog and walk it, so good health leads to owning a dog, rather than the dog leading to good health. Second, a third thing could cause both: people with more time or money might be more likely to own dogs and also more likely to exercise or see a doctor regularly. The finding is a correlation, and by itself it cannot tell these explanations apart.
Practice
Choose an answer, then press Check. The explanation opens either way.
A study of 50 neighborhoods finds that neighborhoods with more fire trucks on the scene of a fire tend to have more damage. Which is the best explanation?
A bigger fire is the third thing behind both numbers: it calls for more trucks, and it does more damage. “The fire trucks themselves cause the extra damage” is tempting because the numbers rise together, but that mistakes a correlation for a cause.
Which result comes from a sample most likely to stand for all the adults in a city?
A large sample chosen at random from the whole city is the most likely to be like the whole city. The gym survey is tempting because it is large, but people at one gym are not like all adults; for example, they probably exercise more than most.
More practice: Look Again Quiz 5: Reasoning from Data.
Numbers and units in science
Every measurement in science has two parts: a number and a unit, the amount the number counts. “12” alone does not say whether something is 12 centimeters, 12 kilometers, or 12 minutes. On the test, wrong answer choices are often the right number with the wrong unit, so keep the unit attached to the number at every step.
Metric units
Science uses the metric system, the system of measurement used by scientists around the world. Its basic units are:
| What is measured | Basic unit | A common example |
|---|---|---|
| Length | meter (m) | a little more than a yard |
| Mass (how much matter something has) | gram (g) | about the mass of a paper clip |
| Volume (how much space something takes up) | liter (L) | a little more than a quart |
| Time | second (s) | |
| Temperature | degree Celsius (°C) | water freezes at 0 °C and boils at 100 °C at sea level |
The prefixes
Larger and smaller units are made by adding a prefix (a word part at the front) to the basic unit. The same prefixes work for every unit:
| Prefix | Means | Examples |
|---|---|---|
| kilo- | 1,000 of the unit | 1 kilometer (km) = 1,000 meters; 1 kilogram (kg) = 1,000 grams |
| (none) | 1 of the unit | meter, gram, liter |
| centi- | one hundredth (1/100) of the unit | 1 meter = 100 centimeters (cm) |
| milli- | one thousandth (1/1,000) of the unit | 1 liter = 1,000 milliliters (mL); 1 gram = 1,000 milligrams (mg) |
Converting from one unit to another
Because the metric system counts in tens, converting only moves the decimal point. Before you calculate, ask one question: is the new unit bigger or smaller than the old one? If the new unit is bigger, you need fewer of them, so the number gets smaller: divide. If the new unit is smaller, you need more of them, so the number gets bigger: multiply.
A bag of rice at a bodega has a mass of 2.5 kilograms. How many grams is that?
Grams are smaller than kilograms, so the number must get bigger. There are 1,000 grams in a kilogram, so multiply: 2.5 × 1,000 = 2,500.
Answer: 2,500 g.
A bottle of water holds 350 milliliters. How many liters is that?
Liters are bigger than milliliters, so the number must get smaller. There are 1,000 milliliters in a liter, so divide: 350 ÷ 1,000 = 0.35.
Answer: 0.35 L. Check: a liter is a large bottle, and 350 mL is about a third of one, so 0.35 makes sense.
Scientific notation
Scientists often work with very large and very small numbers. Scientific notation writes them in a short form: a number from 1 to 10, multiplied by 10 raised to a power. The power (the small raised number, called the exponent) tells you how many places to move the decimal point.
A positive exponent means a large number: move the decimal point to the right. 3 × 10⁸ means 3 with the decimal point moved 8 places to the right: 300,000,000. That is about the speed of light in meters per second.
A negative exponent means a small number: move the decimal point to the left. 8 × 10⁻⁶ means 8 with the decimal point moved 6 places to the left: 0.000008. That is about the width of a red blood cell in meters. Count the places one at a time; moving five places instead of six is the most common mistake.
To compare two numbers in scientific notation, look at the exponents first. The bigger exponent means the bigger number. Compare the front numbers only if the exponents are the same: 2 × 10⁵ (200,000) is larger than 9 × 10⁴ (90,000), even though 9 is larger than 2.
Using a formula given in the question
The test gives you the formulas you need, either in the question or on a formula sheet. Your job is to put the right number in the right place and carry the units through. Work in four steps: write the formula; write in the numbers with their units; calculate; check that the answer makes sense.
A bar of soap has a mass of 120 grams and a volume of 100 cubic centimeters. Use the formula density = mass ÷ volume. What is its density?
Step 1. Write the formula. density = mass ÷ volume.
Step 2. Put in the numbers with their units. density = 120 g ÷ 100 cm3.
Step 3. Calculate. 120 ÷ 100 = 1.2. The units divide the same way: grams divided by cubic centimeters gives grams per cubic centimeter. So the density is 1.2 g/cm3.
Step 4. Check. The density of water is about 1 g/cm3. Something denser than water sinks in it, and something less dense floats. This soap, at 1.2 g/cm3, should sink in a sink full of water. A bar of soap that sinks is an ordinary thing, so the answer makes sense.
A subway train travels 6 kilometers in 12 minutes. Use the formula speed = distance ÷ time. What is its average speed in kilometers per hour?
Step 1. Write the formula. speed = distance ÷ time.
Step 2. Get the units to match the question. The question asks for kilometers per hour, but the time is in minutes. 12 minutes is 12 out of the 60 minutes in an hour: 12 ÷ 60 = 0.2 hour.
Step 3. Put in the numbers and calculate. speed = 6 km ÷ 0.2 h = 30 km/h.
Step 4. Check. 30 kilometers per hour is a believable speed for a subway train between stops. If you had divided 6 by 12 and called it 0.5 km/h, you would have a train slower than a person walking, and the check would catch it.
If you know any two parts of a formula, you can find the third. For example, time = distance ÷ speed, and distance = speed × time.
Keep the unit with every number. Before converting, ask whether the new unit is bigger or smaller. After calculating, ask whether the answer is a sensible size.
Practice
Choose an answer, then press Check. The explanation opens either way.
A runner’s race is 5 kilometers long. How many meters is that?
Meters are smaller than kilometers, so the number gets bigger: 5 × 1,000 = 5,000 m. 0.005 m comes from dividing instead of multiplying; the size check catches it, since a race is not half a centimeter long.
A rock has a mass of 90 g and a volume of 30 cm3. Using density = mass ÷ volume, what is its density?
90 g ÷ 30 cm3 = 3 g/cm3. 0.33 comes from dividing the wrong way round (volume by mass), which happens when the formula is not written down first.
More practice: Look Again Quiz 6: Numbers in Science.
Simple statistics and probability
Scientists often collect many measurements of the same thing and then describe the whole group with one or two numbers. There are three common ways to find the center of a group of numbers, and one common way to describe how spread out they are.
- The mean is what most people call the average. Add all the numbers, then divide by how many numbers there are.
- The median is the middle number when the numbers are put in order from smallest to largest. If there is an even count of numbers, there are two middle numbers, and the median is halfway between them (their mean).
- The mode is the number that appears most often. A set can have one mode, more than one, or none.
- The range is the largest number minus the smallest. It is not an average; it tells you how spread out the numbers are.
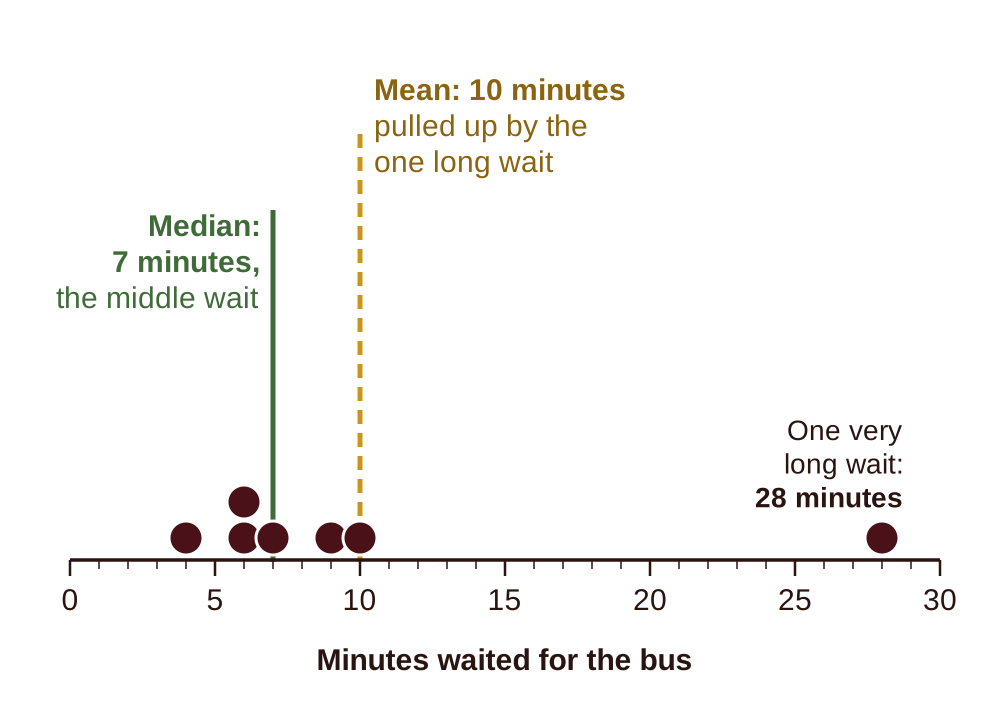
A student wrote down how many minutes she waited for the bus each morning for one week: 6, 4, 10, 7, 28, 6, 9.
Step 1. Put the numbers in order. 4, 6, 6, 7, 9, 10, 28. Do this first, every time. It makes the median, the mode, and the range easy to find.
Mean. Add them: 4 + 6 + 6 + 7 + 9 + 10 + 28 = 70. There are 7 numbers, so divide by 7: 70 ÷ 7 = 10 minutes.
Median. With 7 numbers, the middle one is the 4th from either end. Count in from both ends: 4, 6, 6, 7, 9, 10, 28. The median is 7 minutes.
Mode. 6 appears twice; every other number appears once. The mode is 6 minutes.
Range. 28 − 4 = 24 minutes.
Which number best describes a typical morning? The mean is 10 minutes, but six of the seven waits were 10 minutes or less, and five were under 10. One very long wait, 28 minutes, pulled the mean up. The median, 7 minutes, describes a typical morning better. When one number is far from the rest (an outlier), it moves the mean a great deal and the median hardly at all.
With an even count. Suppose she adds an eighth morning, a 5-minute wait. In order: 4, 5, 6, 6, 7, 9, 10, 28. The two middle numbers are 6 and 7, so the median is halfway between them: (6 + 7) ÷ 2 = 6.5 minutes.
Put the numbers in order first. When one number is far from the rest, the median usually describes the group better than the mean.
Simple probability
Probability is the chance that something will happen. To find a simple probability, divide the number of ways the thing can happen by the total number of things that could happen:
probability = number of ways it can happen ÷ total number of possible outcomes
Probability can be written as a fraction, a decimal, or a percent. It always runs from 0 (cannot happen) to 1, or 100 percent (certain to happen). An answer above 100 percent means something went wrong.
A community center sells 200 raffle tickets. A GED class buys 10 of them. One ticket is drawn. What is the chance that the winning ticket belongs to the class?
The number of ways it can happen: the class holds 10 tickets. The total number of possible outcomes: 200 tickets could be drawn.
probability = 10 ÷ 200 = 1/20 = 0.05 = 5 percent.
Answer: 1 in 20, or 5 percent. The fraction, the decimal, and the percent all say the same thing.
Two more points about chance:
- A probability is not a promise. A coin has a 1 in 2 chance of landing heads. That does not mean exactly 5 heads in every 10 flips. In 10 flips you might get 4 or 7. Over a great many flips, the share of heads settles close to one half. Small numbers of tries wander; large numbers settle down. This is the same reason a study needs a large enough sample.
- Two separate chances multiply. When one event does not affect the other, such as two coin flips, the chance of both happening is the two chances multiplied: 1/2 × 1/2 = 1/4. Both happening is always less likely than either one alone.
Probability comes back in genetics. A chart called a Punnett square shows the chances that a child will inherit a trait from two parents. For example, it can show that each child of two particular parents has a 1 in 4 chance (25 percent) of a certain trait. That is a chance for each child, not a promise about a family of four: a family can have none, one, or several children with the trait. The Genetics study guide explains Punnett squares step by step.
Practice
Choose an answer, then press Check. The explanation opens either way.
Five plants in a class experiment grew 3, 5, 5, 6, and 11 centimeters. What is the mean growth?
3 + 5 + 5 + 6 + 11 = 30, and 30 ÷ 5 = 6 cm. 5 cm is tempting because it is both the median and the mode, but the question asked for the mean. 30 cm is the total, before dividing.
A jar holds 12 red beads and 8 blue beads. Without looking, you take one bead. What is the probability that it is blue?
There are 8 blue beads out of 12 + 8 = 20 beads in all, so the chance is 8/20 = 0.4 = 40 percent. 8/12 is the tempting mistake: it divides by the number of red beads, but the bottom of the fraction must be the total of all the beads.
More practice: Look Again Quiz 7: Statistics and Probability.
The terms in this guide
Science practices the reading, reasoning, and number skills used on every question of the GED Science test.
Stimulus the passage, table, graph, or diagram that comes with a test question.
Main idea what a whole passage is mostly about, in one sentence.
Evidence what was observed or measured.
Claim a statement about what the evidence means.
Hypothesis a possible answer to a question, stated so that a test could show it to be wrong; often an “if … then” sentence.
Variable anything in an experiment that can change.
Independent variable the one thing changed on purpose in an experiment.
Dependent variable what is measured to see the effect of the change.
Controlled variables (constants) everything kept the same so that only the independent variable differs.
Control group the group that gets no treatment, used for comparison.
Experimental group the group that gets the change being tested.
Repeated trials running a test more than once, or with many items, so that chance is less likely to explain the result.
Replication other people repeating an experiment, separately, to check its result.
Trend the general direction of a set of numbers or points.
x-axis, y-axis the line along the bottom of a graph (x) and the line up the side (y).
Interpolation estimating a value between two measured points.
Extrapolation estimating a value beyond the measured points; risky.
Outlier a value far from the rest of the data.
Correlation two things that tend to happen or change together.
Causation one thing making another thing happen.
Sample, sample size the group actually studied, and how many are in it.
Unit the amount a measurement counts in, such as meters, grams, or minutes.
Kilo-, centi-, milli- prefixes meaning 1,000 of the unit, one hundredth of it, and one thousandth of it.
Scientific notation a short way to write very large or very small numbers, such as 3 × 10⁸.
Density mass divided by volume; how much matter is packed into a given space.
Mean the sum of the numbers divided by how many there are; the usual “average.”
Median the middle number when the numbers are in order.
Mode the number that appears most often.
Range the largest number minus the smallest.
Probability the chance something will happen: the number of ways it can happen divided by the total number of possible outcomes.
15 questions on this guide
Check yourself
Choose an answer, then press Check. The explanation opens either way.
A student placed ice cubes of the same size on plates made of different materials, in the same room, and timed how long each took to melt.
According to the table, on which plate did the ice melt fastest?Plate material Minutes for the ice cube to melt Metal 6 Glass 11 Plastic 14 Wood 17 Metal. Fastest means the fewest minutes, and the metal plate took 6 minutes, the smallest number in the column. Wood is the tempting choice because 17 is the number that stands out, but 17 minutes was the slowest melt, not the fastest.
Use the ice cube table from the question above. Which conclusion does the table best support?
This choice stays inside the evidence: it names this test and the two plates compared. “Metal plates are always colder” is tempting because metal often feels cold to the touch, but the table measured melting times, not plate temperatures, and the word always claims far more than one test shows.
Which of these is a hypothesis?
A hypothesis is a statement that a test could show to be right or wrong, and the “if … then” sentence is exactly that. The second choice is tempting because it is about the same experiment, but it is a question, and a question comes before the hypothesis. The last choice is data, which comes after.
A nurse at a clinic in Brooklyn wants to know whether a text-message reminder helps patients arrive on time. For one month, 50 patients get a reminder text the day before their visit, and 50 patients get no text. All 100 have morning appointments at the same clinic. She records how many patients in each group arrive on time.
What is the dependent variable?The dependent variable is what is measured: how many patients arrive on time. Whether a patient gets a text is the tempting wrong choice, but that is what the nurse changed on purpose, so it is the independent variable. Remember: independent is what you do; dependent is what you watch.
Use the clinic passage from the question above. Which group is the control group?
The control group gets no treatment, so it shows what happens without the reminder: the 50 patients who get no text. The patients who get a text are the experimental group. If you chose them, you may have read “control” as “the group that gets something done to it.”
A student wants to know whether music helps houseplants grow. She puts one plant next to a radio in a sunny window. She puts a second plant, with no music, in a dark closet. After a month the first plant is much taller. What is the main problem with her experiment?
Two things changed at once: music and light. Plants need light to grow, so the sunny window alone could explain the difference. Measuring more often sounds scientific and is tempting, but more measurements of an unfair comparison still cannot tell you which change mattered.
A student measured a bean plant every two weeks.
About how tall was the plant at week 3?Week Height of bean plant (cm) 0 2 2 6 4 12 6 15 8 16 Week 3 is halfway between week 2 (6 cm) and week 4 (12 cm), so the height was about halfway between: 9 cm. This is reading between two measured points (interpolation). 3 cm is tempting because it matches the week number, but it is not a height in the table at all.
Use the bean plant table from the question above. Another student predicts that the plant will be 40 cm tall at week 16. Why should you be careful with this prediction?
Estimating far past the last measurement (extrapolation) is risky, and here the growth had already slowed, from 6 cm in two weeks (weeks 2 to 4) to just 1 cm (weeks 6 to 8). The last choice is tempting because it sounds careful, but it goes too far: short, careful predictions from a table are often reasonable.
A survey found that people who carry a cigarette lighter are more likely to develop lung disease than people who do not. What best explains this finding?
People who carry lighters are more likely to smoke, and smoking is a cause of lung disease. Smoking is the third factor behind both. The first choice is tempting because it treats the correlation as a cause, which is exactly the mistake the question is testing.
A store owner asks 4 customers whether they want the store to stay open later. 3 say yes. She concludes that 75 percent of the people in her neighborhood want later hours. What is the biggest problem with her conclusion?
The sample is tiny, and it is only her customers, not the whole neighborhood. One different answer would change the result from 75 to 50 percent. The arithmetic choice is tempting if you rush, but 3 ÷ 4 is 0.75, which is 75 percent; the problem is the sample, not the math.
A bottle holds 1.5 liters of juice. How many milliliters is that?
Milliliters are smaller than liters, so the number must get bigger. There are 1,000 milliliters in a liter: 1.5 × 1,000 = 1,500 mL. 0.0015 comes from dividing instead of multiplying; a bottle of juice is not a tiny drop.
A block has a mass of 60 grams and a volume of 40 cubic centimeters. Use the formula density = mass ÷ volume. What is the density of the block?
60 g ÷ 40 cm3 = 1.5 g/cm3. 0.67 is the most tempting wrong answer: it comes from dividing volume by mass, the wrong way round. Write the formula first, then put the numbers in.
A student counted the birds at a feeder each morning for five mornings: 4, 7, 7, 9, and 23. Which number best describes a typical morning?
Four of the five mornings had 9 birds or fewer. One morning with 23 birds pulls the mean up to 10, above every other count. The median, 7, describes a typical morning better. The mean is tempting because it is what most people call the average, but an outlier moves the mean much more than the median.
A community center sells 200 raffle tickets, and your family buys 10. One winning ticket is drawn. What is the chance that it is one of your family’s tickets?
10 tickets out of 200: 10 ÷ 200 = 0.05 = 5 percent, or 1 in 20. 10 percent is tempting because the number 10 is in the question, but the 10 tickets must be divided by the total of 200 tickets.
Read the sentence: “Our study of 30 adults proves that walking after meals lowers blood sugar in everyone.” Which word claims more than a study of 30 adults can show?
One study of 30 people can suggest or support an idea, but it cannot prove it. (The words “in everyone” also go too far.) “Lowers” is tempting because it states an effect, but it is simply what the study measured; a careful version would say the study suggests that walking after meals lowers blood sugar.